One uncomfortable truth about quick commerce in India: many brands are celebrating revenue growth on Blinkit, Zepto and Swiggy Instamart without actually knowing their contribution margin.
I see this constantly. A brand logs into its dashboard, sees orders climbing, GMV going up, SKUs appearing across more dark stores. It looks like growth. Leadership shares screenshots. The team is motivated.
Meanwhile, the actual P&L tells a completely different story.
In quick commerce, the cost structure is different from Amazon. The replenishment cycle is different. The expiry exposure is different. The discounting dynamics are different. If you bring your traditional ecommerce P&L thinking into Blinkit or Zepto without adjusting for how this channel actually works, you will make the wrong decisions — and you will make them at speed, because quick commerce moves fast.
This article covers the correct way to build a Q-Commerce P&L, how to segment your SKUs so that growth capital goes to the right places, and the four metrics that brands who are actually winning on these platforms obsess over. Everything here is directly from working with brands across all three platforms — not from documentation, not from platform marketing material.
One Uncomfortable Truth About Q-Commerce Revenue
Here is something most Q-Commerce guides will not tell you directly: a SKU doing Rs 30 lakh per month in gross sales on Blinkit might be contributing less to your business than a smaller, steadier SKU doing Rs 10 lakh.
How? Because the Rs 30L SKU is running heavy brand-funded discounts, burning ad credits, has a 60-day shelf life with inconsistent replenishment causing expiry write-offs, and was designed for general trade — not for q-commerce pack economics. The contribution per unit, after all deductions, is barely positive. In a heavy promotional month, it is negative.
The Rs 10L SKU? No ads, lower commission category, stable velocity, long shelf life, clean replenishment. It contributes more real money to the business than the "hero" SKU by a significant margin.
Topline growth hides inefficiency. Contribution margin reveals truth. And in quick commerce — where losses can compound at the speed of the channel itself — the gap between these two numbers can make or break your business.
If you are copy-pasting your Amazon unit economics to Blinkit or Zepto, stop. The cost structure is fundamentally different. Platform commission rates, brand-funded discount expectations, dark store storage charges, expiry provisions and working capital cycles all behave differently here. Build the P&L from scratch for each platform and each SKU. One size does not fit all.
How to Build a Correct Q-Commerce P&L
Here is a practical structure you can implement immediately. Most brands complete Step 1 and stop. That is the mistake. All three steps are necessary to see the actual picture.
Step 1 — Start with Net Realisation, Not MRP
MRP is not what you earn. It is the starting price before the platform takes its share. Your actual starting number for any P&L calculation is Net Realisation — what remains after all platform-level deductions.
On a Rs 100 MRP product, you may be starting your real P&L at Rs 57 — or lower, depending on your category and how aggressively you participate in platform promotions. That is not a commission issue. That is your economic reality before you count a single cost you own.
Now, does your margin still look comfortable? Many brands stop here and call this their "sell price." That is the second mistake. Net Realisation is the starting point, not the answer.
Not sure what your Net Realisation actually looks like on Blinkit? Use the free Blinkit Seller Price Calculator to calculate your real settlement after commission, fulfilment and storage deductions. Once you have your Net Realisation figure, use the framework in this article to complete the full contribution margin calculation.
Step 2 — Subtract Variable Costs to Find True Contribution Per Unit
From Net Realisation, subtract every direct variable cost associated with producing and delivering that unit on quick commerce.
- COGS your manufacturing or procurement cost. Use the cost for the actual q-commerce pack size, not your general trade or Amazon format. If you sell a 200ml GT format and a 50ml q-commerce format, their per-unit costs are different and must be modelled separately.
- Packaging adjustments Q-commerce packs are often different from what you sell on Amazon or in modern trade. Smaller formats, tamper-proof requirements, different carton sizes. These have different unit economics and must be costed at the q-commerce SKU level.
- Logistics and CFA cost the cost of getting inventory into the platform's supply chain, including your Carrying and Forwarding Agent charges and inbound freight.
- Expiry provision this is the cost most brands ignore, and it is the one that quietly destroys margin month after month. Quick commerce platforms have very low tolerance for near-expiry inventory. Dark stores do not carry weeks of buffer stock. If your replenishment is inconsistent or your demand forecasting is weak, you will face unsold stock write-offs. Look at your last six months of RTV data and calculate what percentage of shipped units were written off. Apply that percentage as a provision to every unit economics calculation.
After subtracting all of these, you arrive at your True Contribution Per Unit.
This number tells you whether you are actually making money on each unit sold, or whether growing volume is simply accelerating a loss. If True Contribution per Unit is weak or negative, scaling volume on any of these platforms will worsen the problem — not improve it.

Step 3 — Add Inventory Cost of Capital
This is the step that separates advanced Q-Commerce operators from most brands on these platforms. Quick commerce demands:
- Faster replenishment — sometimes every 24 to 48 hours into dark stores to maintain availability and fill rate
- Higher service levels stockouts are penalised far more aggressively than in traditional ecommerce, directly affecting search ranking and ad performance
- Lower expiry tolerance you cannot push slow-moving stock to the back of the warehouse and wait it out
This means your working capital is tied up more aggressively in this channel than anywhere else you sell. Add to your P&L:
- Working capital cost the financing cost of money tied up in inventory, whether borrowed or internal capital foregone
- Unsold inventory risk — the probability-weighted cost of stock that does not sell before expiry or before an RTV cycle forces a write-off
Once you have worked through all three steps Net Realisation, minus Variable Costs, minus Inventory Capital Cost — you have the actual picture of what your business looks like on quick commerce. Most brands never reach this point. And that is exactly why so many are unknowingly scaling losses at the speed of the channel.
There is a tempting logic in quick commerce: if I sell more, the fixed costs get diluted and margins improve. This is true in some business models. It is not reliably true in Q-Commerce, where each incremental unit sold comes with its own storage cost, its own expiry risk, its own fulfilment charge and its own ad spend requirement. Scaling bad unit economics makes the losses compound faster, not slower. Fix the P&L first. Then scale.
The Advanced Framework: Segment Your SKUs Into 3 Buckets
Once you have calculated True Contribution at the SKU level, the next step is segmentation. Not every SKU deserves the same investment, the same dark store coverage or the same promotional calendar. Treating them identically is one of the most common ways brands spread working capital too thin in quick commerce.
Segment every SKU into one of these three buckets:
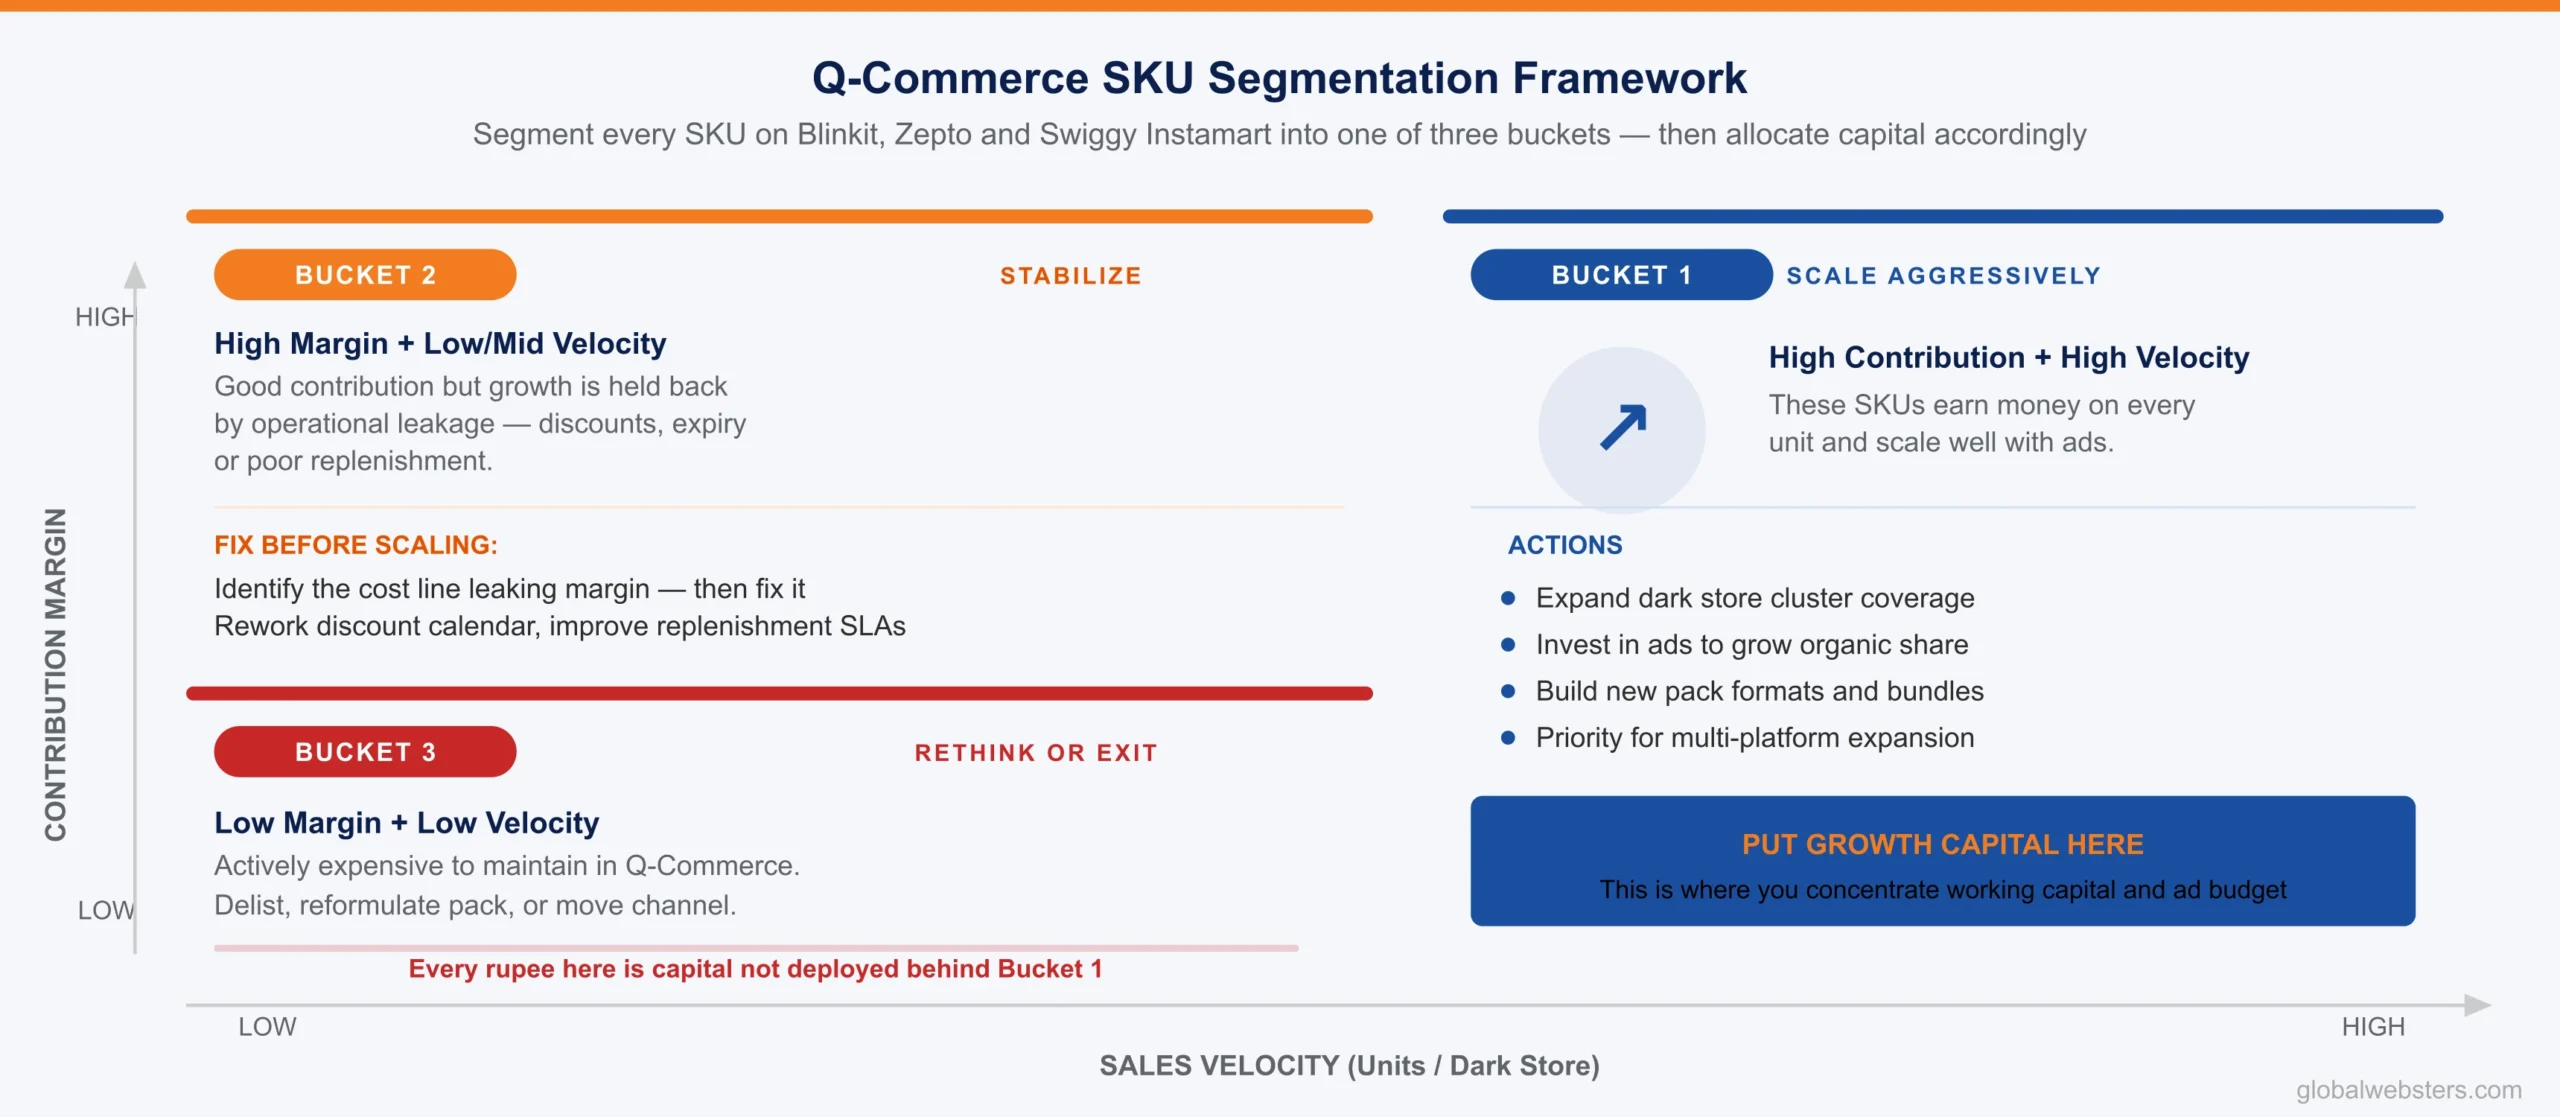
Scale Aggressively
High contribution margin combined with high velocity. These SKUs earn money on every unit and scale well with ad investment.
- Increase dark store cluster coverage
- Invest in ads to build organic share
- Explore new pack formats and bundles
- Priority for multi-platform expansion
Stabilize
Good sales volume but margin leakage somewhere in the P&L. Fix the leak before scaling further.
- Identify which cost line is leaking
- Rework the discount calendar
- Improve replenishment SLAs
- Renegotiate CFA or logistics terms
Rethink or Exit
Low velocity combined with low or negative margin. Actively expensive to maintain in quick commerce.
- Consider delisting from one or more platforms
- Reformulate pack strategy and unit cost
- Evaluate if the category fits Q-Commerce
- Redirect capital to Bucket 1 SKUs
Quick commerce is a high-speed channel. If you scale the wrong SKUs, losses compound quickly. The brands winning on Q-Commerce are not the ones with the biggest portfolios on the platforms. They are the ones that concentrate resources on the SKUs with proven unit economics and make deliberate exit decisions on the rest.
In quick commerce, unlike traditional ecommerce, you cannot let poor-performing SKUs sit quietly. The channel's cost structure replenishment cycles, dark store storage, expiry risk, ad wallet minimums makes underperforming SKUs actively expensive to carry. Every rupee of working capital tied up in a Bucket 3 SKU is a rupee that could be funding growth behind your Bucket 1 portfolio.
The 4 Metrics That Q-Commerce Winners Actually Track
The brands building sustainable businesses on Blinkit, Zepto and Swiggy Instamart are not obsessed with revenue screenshots. They are obsessed with these four numbers — reviewed weekly, not monthly.
Contribution Per Dark Store
Which dark store clusters are generating positive contribution margin, and which are margin-negative because of low velocity, high storage costs or poor replenishment performance? This is your geographic expansion decision-maker. Grow into cities where this number is positive — not where demand feels intuitive based on brand awareness or where sales volumes look large. A cluster with strong revenue but negative contribution is a trap.
Contribution Per SKU
Which SKUs are earning money, which are breaking even and which are quietly losing? This needs to be recalculated monthly not annually because platform commission structures change, promotional calendars shift, and your CFA costs evolve as you scale. The SKU segmentation above is only as useful as the data feeding it. Stale unit economics lead to stale strategic decisions.
Ad-to-Organic Ratio
What percentage of your sales on each platform are driven by paid advertising versus organic placement? A high ad dependency means two things: your true unit economics are weaker than the dashboard suggests, and your demand is rented rather than built. The goal of initial ad investment on Blinkit and Zepto is to build search ranking and repeat-purchase behaviour — then progressively reduce ad share as organic share grows. A healthy organic share after three months of being live is 25 to 30 percent minimum. Below that, diagnose before spending more.
Inventory Turns
How quickly is your inventory moving through the platform's supply chain? Low turns mean high working capital cost, high expiry risk and — on Blinkit's SOR model — delayed next POs which further reduce your ranking. Strong operators maintain tight inventory turns through accurate demand forecasting, lean replenishment planning and SKU rationalisation. This metric connects directly to both your P&L and your dark store availability score — which in turn affects both organic ranking and ad performance. Everything in Q-Commerce is connected.
If you can confidently report on all four of these metrics — at the SKU level, at the dark store cluster level, every week — you are operating at a level that most brands on Blinkit, Zepto and Instamart have not reached. That precision is the competitive moat that separates the brands building durable positions from those renting short-term growth.
Why Q-Commerce Rewards Precision More Than Any Other Channel
In traditional ecommerce — selling on Amazon or your own D2C website — a bad SKU takes months to become a visible problem. The channel moves slowly enough that you have time to notice, diagnose and course-correct before the damage is severe.
Quick commerce is not like that. Products move in minutes. Replenishment happens in hours. Promotions run over days. If you are scaling the wrong SKUs on Blinkit or Zepto, losses compound at a speed that is proportional to the channel's own velocity.
This is why getting unit economics right before scaling is not optional. It is the foundation that every other Q-Commerce decision rests on — your dark store expansion plan, your SKU listing decisions, your ad investment allocation, your promotional calendar, your inventory planning across three different platform supply chains.
Get the foundation wrong, and every subsequent decision accelerates in the wrong direction.
What to Do This Week If You Are Already Live on Quick Commerce
- Pull 90 days of SKU-level sales data from every platform separately. Do not aggregate across platforms — Blinkit, Zepto and Instamart have different commission rates, different storage models and different payment cycles. Each needs its own P&L.
- Calculate Net Realisation for your top 10 SKUs on each platform. Use numbers from your actual settlement reports — not the rate card. Settlement reports reflect what was actually deducted, including promotional adjustments and any penalties.
- Subtract your variable costs using the q-commerce pack size specifically. If your q-commerce format is different from your Amazon or general trade format, use that unit's actual cost not an average across formats.
- Build an honest expiry provision. Look at your last six months of RTV data. Divide total write-off value by units shipped. Apply that percentage to every forward unit economics calculation.
- Segment every SKU into Scale, Stabilize or Rethink for each platform. A SKU can be in different buckets on different platforms if the commission structure or velocity differs.
- Make capital and growth decisions from the segmentation. Not from revenue rank. Not from which SKU has the most orders. From which SKU generates the best contribution margin at sustainable volume.
This exercise takes a few hours. It will probably be uncomfortable — you will discover SKUs you thought were winners that are breaking even or losing. Do it anyway. The clarity is more valuable than the comfort of not knowing.
Quick Commerce P&L FAQs
The Bottom Line
Quick commerce is one of the most exciting retail channels to emerge in India in the last decade. Blinkit, Zepto and Swiggy Instamart have fundamentally changed how urban India buys everyday products, and the opportunity for brands and manufacturers is real.
But it is a channel that rewards precision. The brands building durable, profitable businesses on Q-Commerce are not the ones with the best revenue screenshots or the most SKUs listed. They are the ones who know exactly what they earn on every unit, in every dark store, on every platform — and who make decisions based on that clarity rather than on topline growth.
Build your P&L correctly. Segment your SKUs intelligently. Scale what actually works. Rethink what does not.
Revenue is vanity. Contribution is sanity.
Need Help Building Your Q-Commerce P&L or Scaling Profitably?
At Global Websters, we help brands and manufacturers navigate quick commerce profitably from P&L structuring and SKU segmentation to dark store expansion and platform negotiations across Blinkit, Zepto and Swiggy Instamart. Use the free Blinkit Profit Calculator to start with your fee breakdown, or talk to our Quick Commerce Enablement team if you want to build the full picture together.